Scientists Mine 16th Century Ship Logs for Geophysical Research
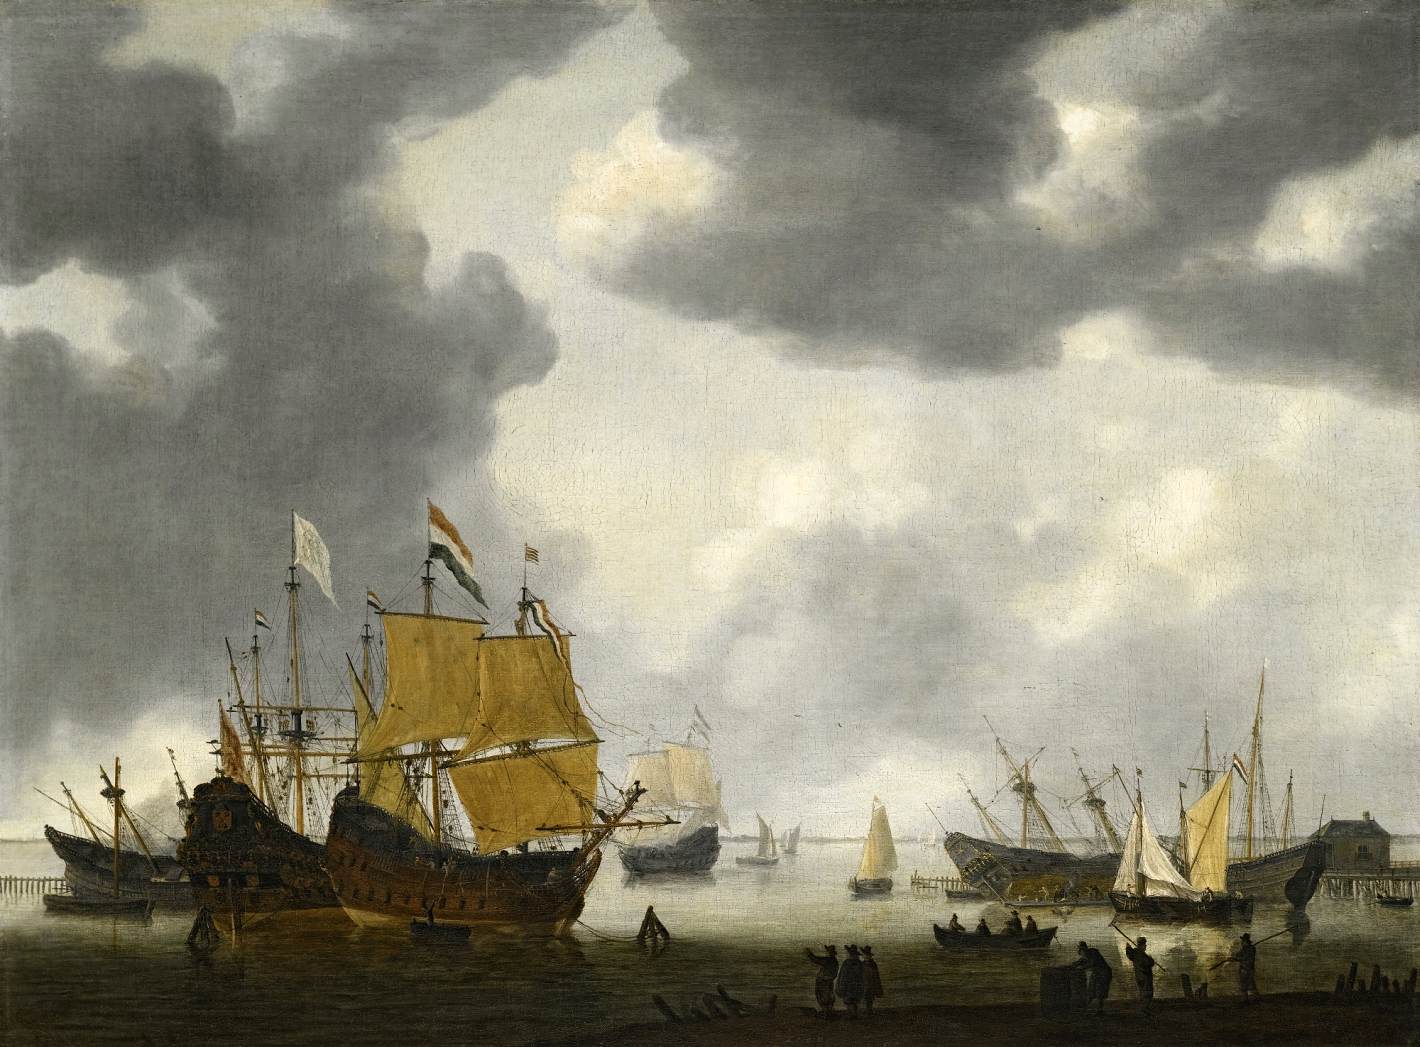
Dutch dock workers tip merchant ships on their side for repairs in the seventeenth century. Credit: Reinere Nooms
As ships explored the world from the Age of Sail through 20th century, mariners kept detailed navigation records using the Sun and stars. Scientists scoured these ship logs, many of which are preserved in European libraries, for clues about Earth’s magnetic field. The work, published in 2000, created the first-ever magnetic field map for the past 4 centuries.
Third Pod spoke with the historian who launched the project about the trials and tribulations of turning historical measurements into cutting-edge scientific data. Along the way, Nanci Bompey learns about sea shanties.
This episode was produced by Jenessa Duncombe and mixed by Kayla Surrey.
Transcript
Shane Hanlon (00:00):
Hi, Nanci.
Nanci Bompey (00:01):
Hello, Shane.
Shane Hanlon (00:03):
How are you?
Nanci Bompey (00:04):
Fine. How are you?
Shane Hanlon (00:05):
Good. Good. So today I want to talk about sea shanties.
Nanci Bompey (00:10):
I do not know what that is.
Shane Hanlon (00:11):
Oh my gosh. All right, We are just going to bring in our co-producer Jenessa. Hi Jenessa.
Jenessa Duncombe (00:18):
Hey guys.
Shane Hanlon (00:19):
Can you explain to Nanci what a sea shanty is?
Jenessa Duncombe (00:23):
Well, so a sea shanty is something sung by presumably sailors and they would do it while they worked, they would sing and like swab the deck, whatever sailors did. [00:00:49 Sea Shanty]
Nanci Bompey (00:49):
Oh, okay. I mean, I can imagine that.
Shane Hanlon (01:00):
Yeah, they have a cadence here, like dun dun, dun, dun, dun dun or something like that. They are like,
Nanci Bompey (01:07):
So, wait, you said before you started this recording, you said that they were popular now because of COVID. Why like people are making them up? Or like singing them?
Shane Hanlon (01:17):
Yeah. So what happened was that it got popular on TikTok and basically like some, I forget his name, I believe it was an Irish guy like recorded this sea shanty on TikTok. It is a known sea shanty, I guess, in the world of,
Jenessa Duncombe (01:32):
The Wellerman.
Shane Hanlon (01:33):
The Wellerman, Yeah. Thank you. I have never said sea shanty this much in my life, and then people just started on TikTok… You can basically duet people. So you can talk over videos and people just started duplicating this, and duplicating this, and duplicating this and it blew up and sea shanties were a thing for a while. I am actually surprised we did not do anything at AGU or you did not come across them on social media.
Nanci Bompey (01:56):
I mean, maybe, I don’t know.
Jenessa Duncombe (01:58):
It is really prime because you get this like rich baritone. If you do this, like chorus of people, and then you can get some strings in there too. And that the TikTok star was Scottish star Nathan Evans. And he had more than 8 million views last time.
Nanci Bompey (02:18):
All right. Well, I guess I have to go do some TikTok research now. Thanks
Shane Hanlon (02:23):
You are welcome Nanci. This is what we are here for.
Shane Hanlon (02:29):
Welcome to the American geophysical union’s podcast about the scientists and the methods behind the science. These are the stories you will not read in the manuscript or hear in a lecture. I am Shane Hanlon.
Nanci Bompey (02:38):
And I am Nanci Bompey.
Shane Hanlon (02:40):
And this is Third Pod from the Sun. Nanci. We are not just trying to kind of bring you up on the current TikTok trend though, that would just be a fun episode to try and describe some of these things. But yeah, we are going to be talking about well maybe not necessarily sea shanties, but I will let Jenessa who brought us this episode kind of get into the actual description.
Jenessa Duncombe (03:10):
Right. So today we are going to hear a tale about the high seas, which is why I wanted to start with sea shanties. So it is a story about a historian who actually dug through old ship logs for scientific data. These logs were written down by sailors as far back as the 16th century while they were crossing the seas. And so it turns out that these navigational logs that they just needed, so they would not get lost are actually a treasure trove of scientific data, particularly on the Earth’s magnetic field, which is kind of surprising. So researchers today, we study our magnetic field to understand how it protects us from like say solar radiation from the sun, but we do not have many measurements of our magnetic field before satellites and other types of technology. And so these maritime records are really rare and really interesting and took so, so much digging by this historian. So I want to tell you more about his journey, getting into these maritime records, understanding what they mean about the Earth and then publishing a study that has now been cited thousands of times reconstructing the Earth’s magnetic field.
Art Jonkers (04:39):
My name is Art Jonkers. I am a Dutch academic currently working at the Institute for Geophysics at the University of Münster in Germany.
Jenessa Duncombe (04:48):
Before we get started, what exactly is the Earth’s magnetic field and what generates it?
Art Jonkers (04:54):
So the Earth’s magnetic field is a force field. You can imagine field lines that exit at the South pole and going all the way around the Earth, outside the Earth’s atmosphere into space, curving back in towards the North pole and there entering again. So this is a field that affects instruments at the surface. For example, your compass, your compass will try to align itself with the local magnetic field lines, just like iron filings on a piece of paper, will try to follow the field lines of a bar magnet that you hold underneath. But the Earth’s field is not a bar magnet of planetary proportions because it is far too hot inside the Earth and the bar magnet would melt almost instantly. So, instead it is a complicated process of the fluid motions and the Earth’s rotation that generate a so-called liquid or fluid dynamo process.
Jenessa Duncombe (05:56):
So why does the magnetic field change?
Art Jonkers (05:58):
Because it is generated not by a fixed bar magnet, but by a convecting spinning liquid, it is just like airflow in the atmosphere, only down, deep, deep down at the top of the outer core and fluid flow affects a magnetic field and the magnetic field affects the fluid flow. So it gets to be very complicated and it changes over time.
Jenessa Duncombe (06:24):
How did you get into this work?
Art Jonkers (06:26):
I am fascinated with the notion of discovering a hidden layer of information. My focus in history was on maritime history and the history of science. And that is where you have many scattered sources of people making natural observations all over the world. But this tends to be very patchy. So I knew I had to have a global way into understanding whatever I was going to be looking at. And in my case, I was interested in the geomagnetic fields. So I needed a geophysically sound reconstruction of the field at that time. So I got in contact with the people at Leeds who were the geophysicists there, were trying to do the exact same thing, trying to reconstruct a field in the past.
Jenessa Duncombe (07:14):
As part of his historical research, Art was looking into what scientists back in history thought the Earth’s magnetic field looked like. In order to compare their records with what was actually happening on Earth, he thought scientists must have some reference somewhere, right? Some map of what the Earth’s magnetic field used to look like. But it turns out they do not at least not over the last couple of hundreds of years. There is actually a gap in our understanding of how Earth’s magnetic field has changed. We know what it looked like throughout millions of years of Earth’s history, because you can actually look at records in old rocks and look at how their minerals recorded the magnetic field. But you can not do that for more recent rocks, and so we have this gap in our record. Art was frustrated by this understandably and he decided to make his own blueprint of what the Earth’s magnetic field must have looked like over the last 400 years. He looked through maritime records and found measurements called magnetic declination to help him. So, you used measurements of magnetic declination to reconstruct the magnetic field. What is that?
Art Jonkers (08:37):
I tend to call it the third coordinates because you often find descriptions of ports and other land sightings, specifying latitude, so-and-so magnetic declination, such and such. Or if longitude is measured, then you often find triplets so latitude, longitude, magnetic declination. So magnetic declination is simply the difference between true North, the top of your map, and the direction where your compass needle is pointing.
Jenessa Duncombe (09:09):
What did you have to do to, to get the data, to get these historical measurements.
Art Jonkers (09:15):
The large majority of the observation’s comes from East India voyages, and that’s based on the colonial enterprises of large what we would now call multinationals with their own armies, and there were certainly not very nice in the colonies to the people they were trying to exploit there.
Jenessa Duncombe (09:36):
Art goes and finds these old documents that are actually still around in libraries in Europe. And he looks over logs from the 16th to 20th centuries. This was a time when countries in Western Europe sent ships all over the world, along the way, mariners took meticulous navigation box of magnetic declination. Art set off on years-long quest to unearth these measurements.
Art Jonkers (10:12):
I spent three years in London, Paris, Copenhagen, Seville, and that is where the historian skills also come into play because you need to know your study objects. You need to know how these maritime organizations were structured. So where did the documents end up? Individual archives were at great places. You get to go to places where the general public is not allowed in. So for the best place for me, I liked the most was the Bodleian library at the University of Oxford, where before you get access, you have to solemnly swear not to kindle any flame on the premises. This is great, and then you eventually get access and there are these massive rows of wood carved book stands and then paintings on the wall and it’s like something out of a Lord of the Rings. You half expect Gandalf to sit in the corner studying some ancient talk.
Jenessa Duncombe (11:14):
When you are handling these documents, do you have to wear gloves? Like, is it just very… Everyone has to be, I don’t know, you almost have to be silent so that you just don’t, it doesn’t disintegrate in front of you.
Art Jonkers (11:40):
Well, it is not quite that bad. It is actually pretty sturdy. It has to survive an ocean voyage or two. It has stood the test of time much better than many modern paper documents would. But the navigation log book, it is great to handle these manuscripts. You do not have to wear gloves most of the time, but you do get very dirty fingers after a while. There is also sand in the binding because they threw it over the page to let the ink dry. And some of that sand then drops out when you open the manuscripts, and so if you touch that, then you may be the first person to touch that sand since the author touched it 300 years ago. Wonderful.
Jenessa Duncombe (12:28):
Something that I find really cool about these logs is that people were sailing all over the world during that time. From Europe, across the Atlantic, but also down into the Indian Ocean, into the Tasman Sea, even all the way to the Pacific. Art worked with geophysicists Andrew Jackson, Anne Murray and Matthew Walker at the University of Leads to turn the measurements into something scientifically rigorous. They had to triangulate where the ships actually were in space, and account for the errors that navigators made along the way. At times, the work was a slog.
Art Jonkers (13:10)
The hardest part of it was the psychological toll, because you basically, you have to be sufficiently obsessive compulsive to keep going and focused, but not so compulsive that you go completely crazy and you have to work in the dark for about three years, because we had to complete the entire archival phase before we could get onto the post-processing of correcting all these voyages spatially, and then do all the calculations. So you never know while you’re working away in the archives, whether what you have got is good enough to be able to succeed.
Jenessa Duncombe (13:47):
Wow. How did you keep going?
Art Jonkers (13:50):
Well, I like to walk lot, so on my free days, I got to know Paris very well and London is my all time favorite city and yeah. And reading cartoons sometimes to get your mind off things.
Jenessa Duncombe (14:13):
Flipping through these log books really transported Art back in time onto the high seas. And I am kind of jealous of him. So I asked if he could send us a snippet from an old log book. He sent us this passage from a very unfortunate expedition in 1769. And it is going to be read by the wonderful Alex Howe.
Alex Howe (14:44):
Very strong gales with excessive hard squalls and rain, and a very large sea with a dark dismal looking sky. At noon finding we had not the least prospect of a shift when consulting with my officers, we unanimously agreed to bear away thinking we would be running too greater risk with the ship and ourselves to beat any longer in the sickly condition we are in having 28 people incapable of doing any duty and hardly a man on board that is not effected with the scurvy in some shape or other. We looked upon St. Augustine’s Bay on the Island of Madagascar to be the best port, knowing that there were plenty of good provisions to be had, which was the chief thing we wanted
Art Jonkers (15:27):
In stormy weather their writing can get really scribbly. So you know that you have a direct connection with these people as they go through this voyage. And occasionally there is these spectacular events like lightning strikes in one instance, the ship Dover paralyzing and blinding part of the crew in destroying the rigging’s that is of course spectacular. And the best thing I found, the unforeseen little nuggets you discover were the comet sightings. So occasionally the ship will be at sea. And describe a comet that is not being seen anywhere else on Earth, because they are so far away from the European continent.
Art Jonkers (16:08):
So there is one that comet in 1747 in the South Indian ocean that turned out to be the return leg, leaving the solar system after it had been witnessed the end of 1746 in Europe on its approach to the sun. And so I contacted Brian Marston at the Smithsonian who collects these comets observations in the past. And with that second observation, we were able to pin down the commit orbit much more precisely than before. And it is these little nuggets that make it bearable that then you suddenly discover something totally out of the frame.
Jenessa Duncombe (16:43):
But of course, Art saw not only the wonders of history, but its evils too.
Art Jonkers (16:50):
And then there are numerous accidents being described. The occasional man overboard, the occasional suicides, and similarly there were the slavery logs, which are, navigationally very important because they cross the Atlantic in an east-west direction rather than in a North-South direction. So they cover a different part of the Atlantic in a different way, in a different type of navigation, which is called latitude sailing. But this was acquired a great cost and the slavery logs themselves are deeply unpleasant reading.
Jenessa Duncombe (17:25):
Art and his colleagues use data from many sources. It is hard to know what overall percentage came from slavery ships. Art thinks 6% of the data he looked at came from ships carrying enslaved people. In the past, Western researchers have taken away people’s agency, consent or land in the name of science. While these data were not originally collected on ships for science, it’s a reminder you do not have to look hard or far to find artifacts of racism in our data. And this is a problem that continues today in our algorithms.
Art Jonkers (18:01):
Yeah, you realize that the past really is a foreign country and then people have completely different attitudes to things that we now find totally unacceptable. And there is limits to how much you can get into the mindset of somebody from three, 400 years ago
Jenessa Duncombe (18:24):
In the end Art and his collaborators digitized more than 2000 log books. This work was done back in the nineties. So even though Art wrote computer programs to help with the work, it was still a painstaking process. Art thinks that perhaps if this was done today, you could use artificial intelligence to scan through the log books, but it would be challenging. A lot of these records are in old handwriting in Dutch, French, Spanish, Danish, and Portuguese, all languages that Art can read, by the way. I asked Art, how many of these measurements did the team collect?
Art Jonkers (19:00):
It was 2,400 voyages and 177,000 observations of magnetic declination inclination, and later also intensities.
Jenessa Duncombe (19:11):
So in this study you took these measurements and then you plugged them in into a mathematical model. What did you find?
Art Jonkers (19:19):
So what we got out is what we call gufm1, the global field map of the first ever reconstruction of the geomagnetic field at the top of the core spanning for full centuries, from 1590 to 1990. And since then, it has been extended with satellite observations right up to the present day. And from this field map of the magnetic fields you can reconstruct the fluid flow of the molten iron at the top of the core.
Jenessa Duncombe (19:50):
I was curious about this global field map that all of this work went into creating. So I looked up the paper it’s published in 2000 in the Royal Society. And I’m scrolling through the citations. You can see that this paper has been used in studies of the aurora, the fluid flow of Earth’s core, space weather. I mean, there are all kinds of applications in here.
Art Jonkers (20:19):
The map also captures field features, geomagnetic field features that provide constraints for people that are trying to model the geodynamo. So just putting physics into a computer and then trying to get a realistic Earth-like field. And this is very difficult because these are very complex systems. So everyone with appropriate software can now generate their own field reconstructions for their own studies and separately, the data sets has been deposited with the World Data Center, through the British geological survey at Edinburgh. And hopefully they can also provide food for thought for future generations of investigators of the Earth’s magnetic field.
Jenessa Duncombe (21:01):
How did this project, or did this project change the trajectory of your career?
Art Jonkers (21:06):
It did because I sort of moved out of history after this. Following the PhD, I did a post-doc in geophysics at Leeds university, just to finish up the work and also to rework parts of the thesis into a more accessible book published by Johns Hopkins University press in 2003, called Earth’s Magnetism in the Age of Sail. And this covers both the maritime part of it and also a bit more of the history of science at the time about the ideas that people came up with to explain the Earth’s magnetic field.
Jenessa Duncombe (21:42):
After that, he jumped from fellowship to fellowship and met his wife, who is a seismologist. When she got appointed at the University of Münster, he went with her.
Art Jonkers (21:52):
And so currently I am back into physics and working with my wife on constraining the mineralogy and the lower most mantle I am now finding statistics to seismology rather than geomagnetism, but regardless of the discipline, it always boils down to separating signal from noise and trying to reveal that hidden layer of information. And that is the thrill for me. This is my prime motivation for staying in science, whatever the discipline.
Shane Hanlon (22:27):
It is so fascinating to me that we are able to learn so much about, I guess, in this case, a magnetic fields from the ship logs, what else is out there? Like what else could we learn from other ship logs?
Jenessa Duncombe (22:41):
Oh, so so many things. I mean, these logs include weather information all over the world’s oceans. They also include sightings of whales, which would be cool. And you could even look at sea ice patterns to see how they have changed over time. So, I mean, there is just a lot we can do with essentially measurements that have just been in the dark for centuries.
Shane Hanlon (23:04):
That is very cool. I am looking forward to potentially learning about new things in the future. All right. Well, that is all from Third Pod from the Sun.
Nanci Bompey (23:14):
Thanks to Jenessa for bringing us this story. And of course, thanks to Art for sharing his work with us and an extra thanks to Alex Howe for reading from a quote from a log book.
Shane Hanlon (23:24):
This podcast was produced by Jenessa and thanks to our sound engineer, Kayla Surrey.
Nanci Bompey (23:30):
We would love to hear your thoughts. Please rate and review us on iTunes. You can find us wherever you get your podcasts and at thirdpodfromthesun.com.
Shane Hanlon (23:37):
Thanks all. And we will see you next time.