E6 – The Secret Lives of Tide Gauge Operators
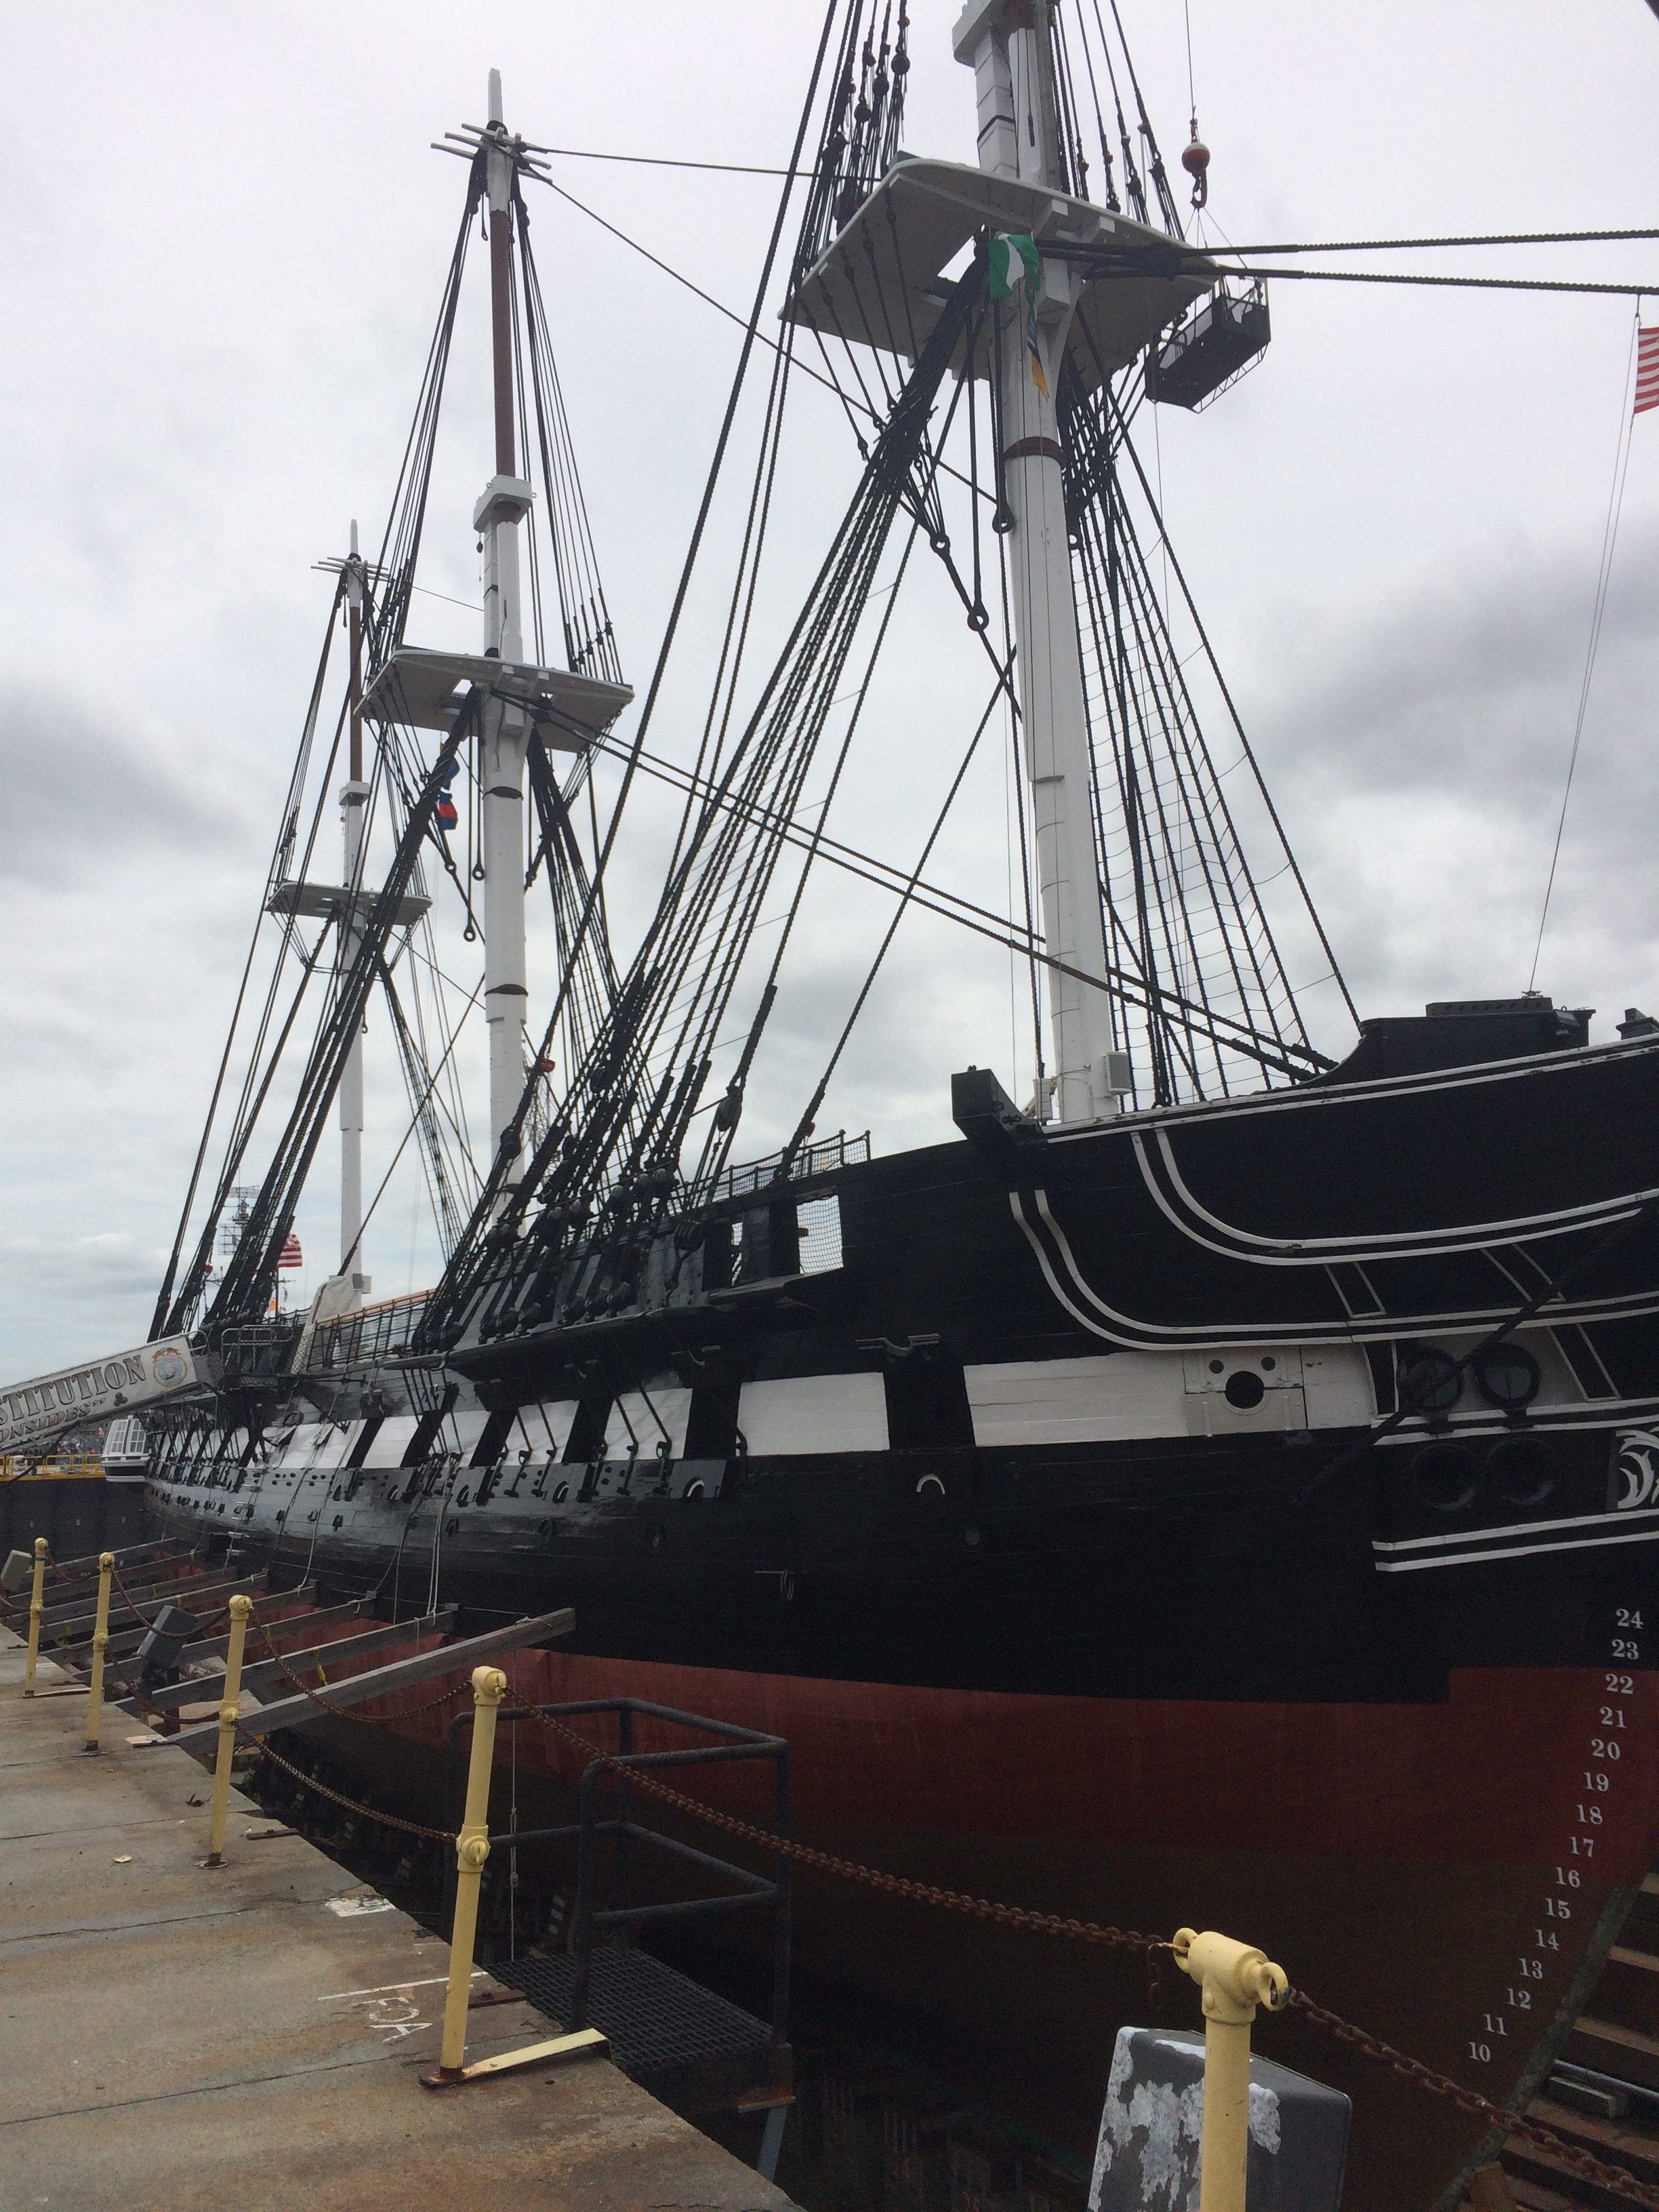
USS Constitution, construction 1833, in dry dock. Credit: Stefan Talke.
In the 1800s and early 1900s, dozens of men stationed at harbors around the United States would record water levels and send them to a central office in Washington, D.C. where they were used by engineers building the country’s infrastructure. Along with these readings, the tide gauge operators also sent letters detailing their lives at these outposts and the difficulties they faced, from extreme weather to personal dramas.
Stefan Talke, an assistant professor of civil and environmental engineering at Portland State University, uncovered these letters as he and his colleagues combed through archives and libraries for tide gauge data to reconstruct to reconstruct mean sea level, tidal processes, and extreme events in cities like New York and Boston. In this episode, hear about the hidden lives of tide gauge operators and how Talke and his colleagues are using the information they find to understand how cities will be affected by rising sea levels due to climate change.
This episode was produced by Nanci Bompey and mixed by Kayla Surrey.
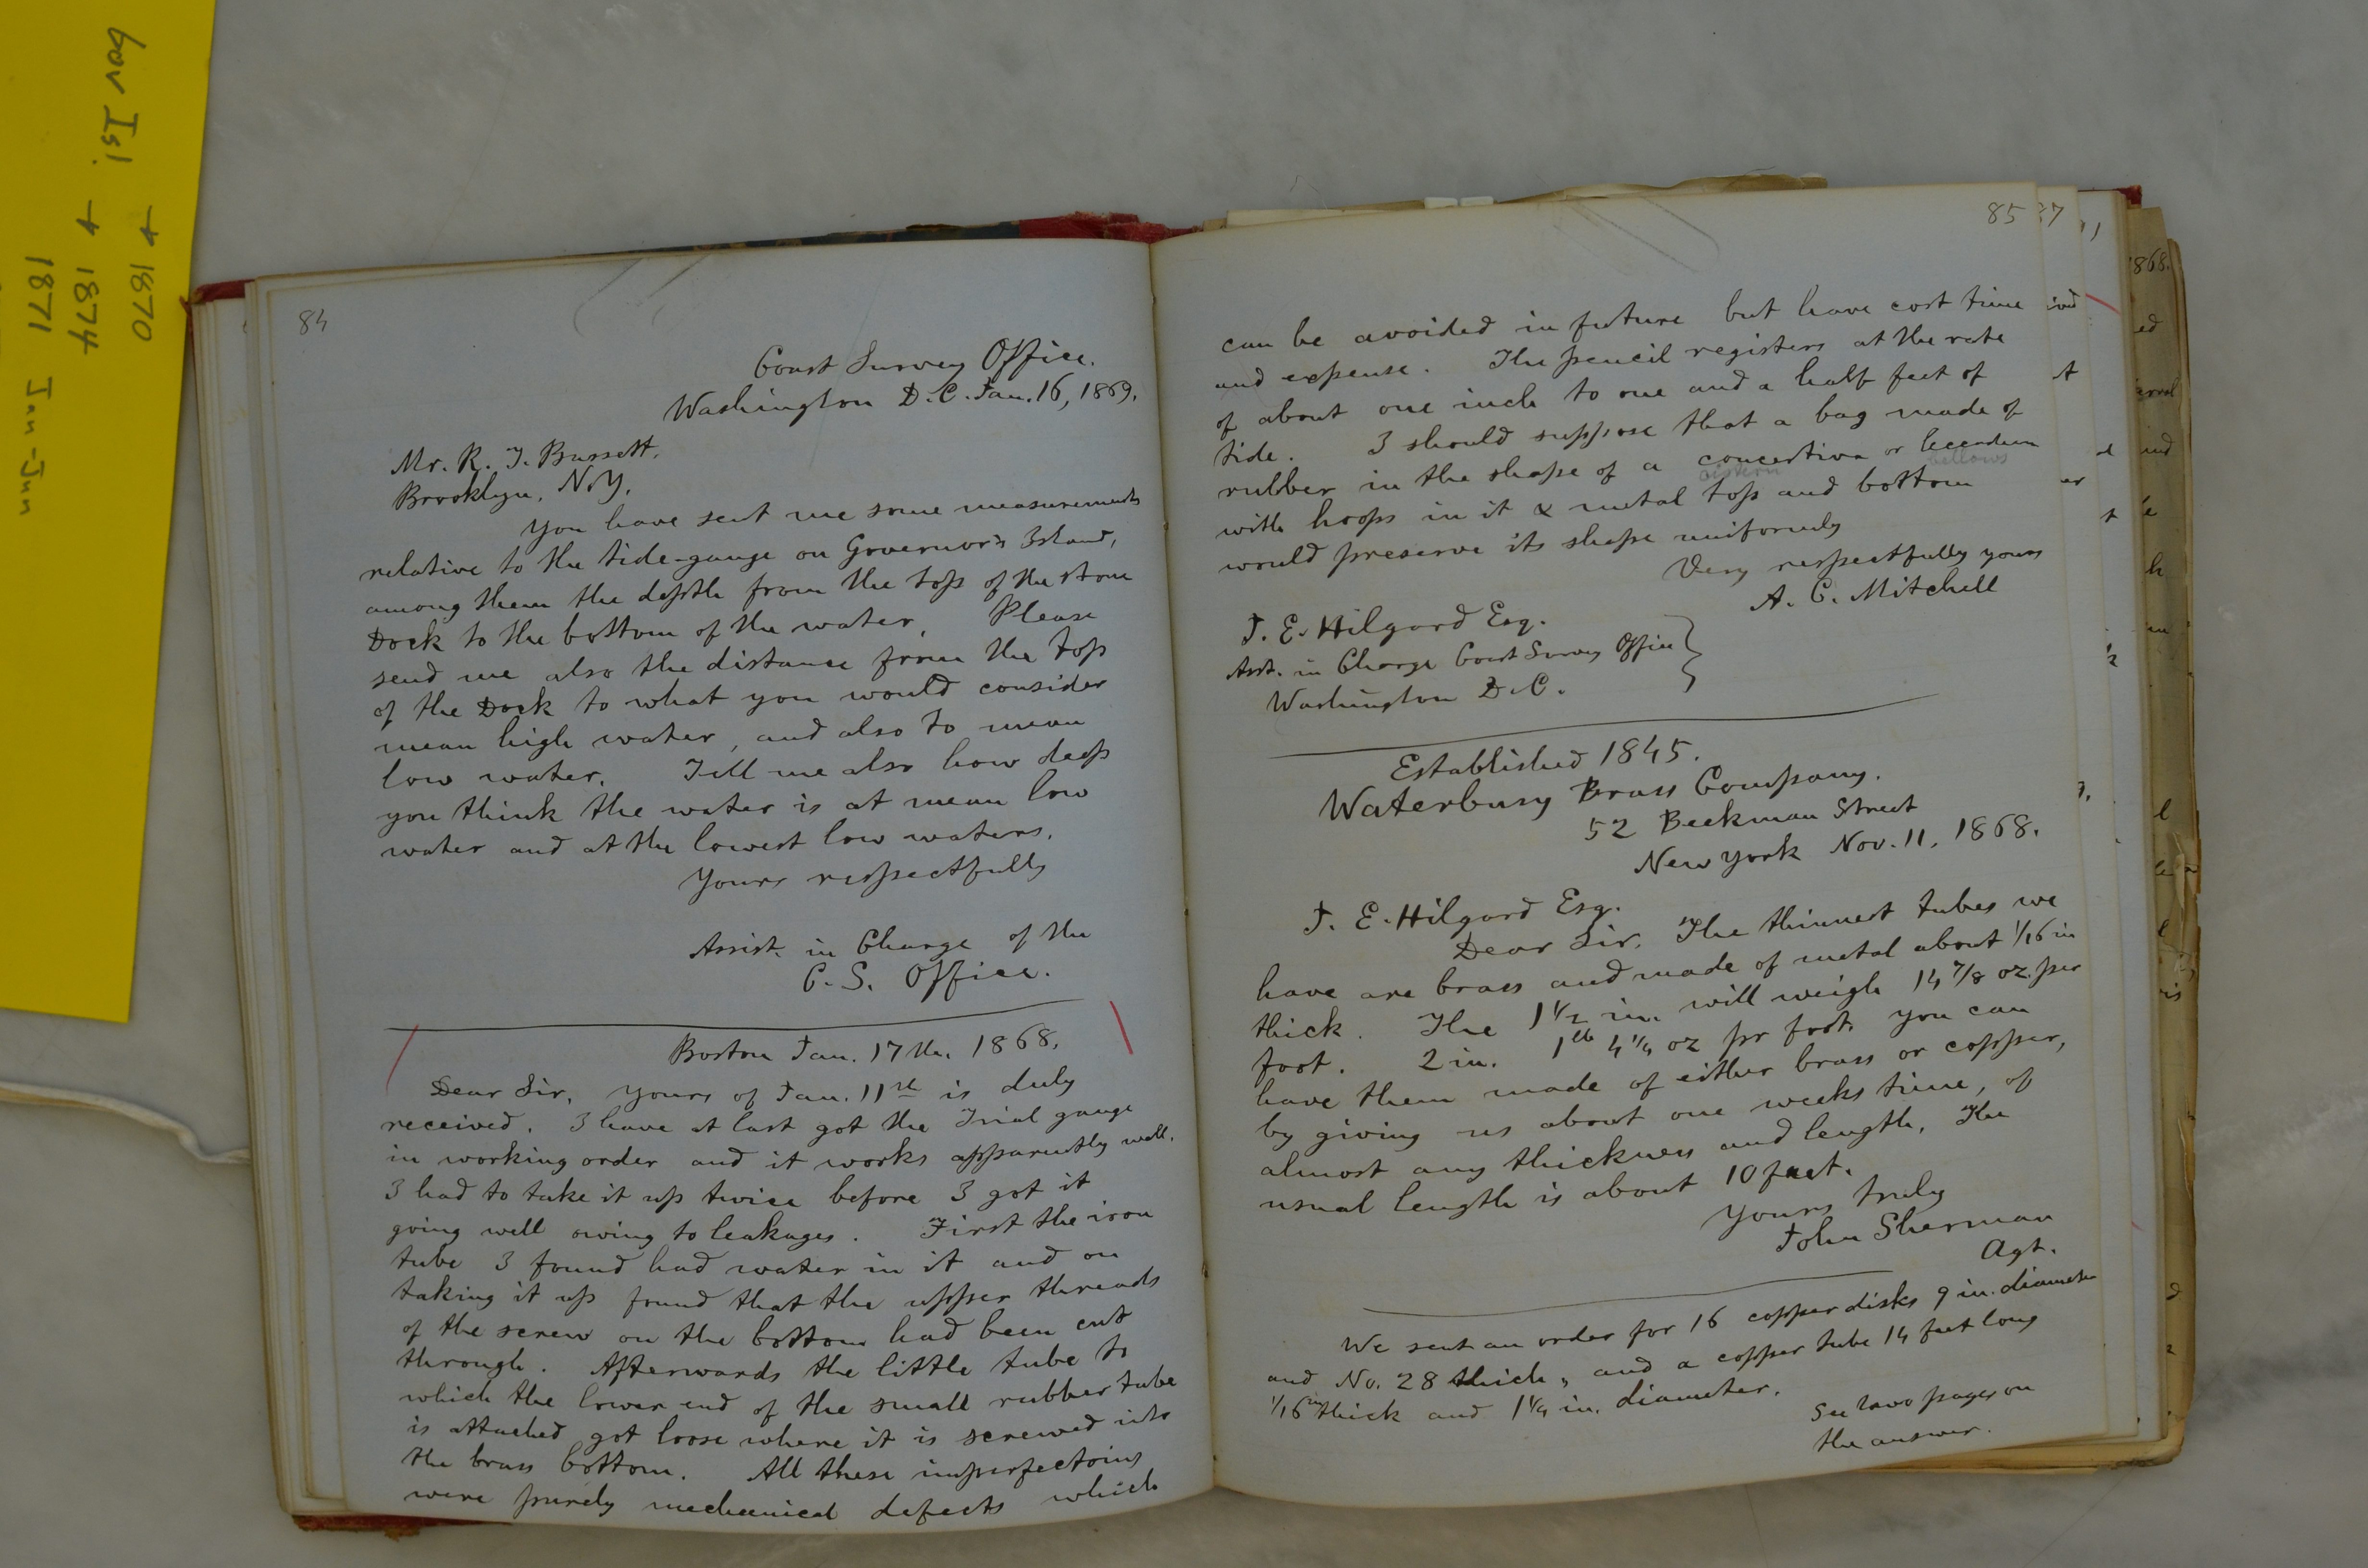
Boston gauge notes. Credit: Stefan Talke.
Episode Transcript
Nanci Bompey: Hello, Shane.
Shane Hanlon: Hello, Nanci.
Nanci Bompey: My turn to, I guess, ask the questions today.
Shane Hanlon: This is going to be interesting.
Nanci Bompey: Yes. If you could be any time period, if you could live in any time period-
Shane Hanlon: Live in any time period.
Nanci Bompey: -what time period would you live in?
Shane Hanlon: Oh, man. I’ve been watching a lot of Westworld recently.
Nanci Bompey: Aha.
Shane Hanlon: Yeah, and there’s something romantic about westerns, and so I thought maybe living in … I don’t know, when would that even be? 1900s, 1800s? I don’t even know when.
Nanci Bompey: Yeah, like the wild west?
Shane Hanlon: I don’t know when the wild west was.
Nanci Bompey: I guess around that time, yeah.
Shane Hanlon: I joke with my parents that I was named after the western Shane. I wasn’t, but they just roll with that. So maybe then, but then I also think that I really like antibiotics, and I just scratched myself with a nail the other day and I like that I don’t have tetanus. I guess that’s a non-answer.
Nanci Bompey: I actually hate westerns.
Shane Hanlon: You hate westerns?
Nanci Bompey: That would be the last place I’d want to be. Yeah.
Shane Hanlon: What would yours be?
Nanci Bompey: I really like medieval stuff, but again, that’s a harsh life. That’s a tough life. I think medieval or the ’70s. [laughs]
Shane Hanlon: [Laughs] Okay, why the ’70s of any recent time period?
Nanci Bompey: I feel like I just would do good in that era. It was fun. I like the music. I don’t know.
Shane Hanlon: The music is why you’re going to go with the ’70s? Medieval or ’70s.
Nanci Bompey: Anyways.
Shane Hanlon: Okay.
Nanci Bompey: The reason I’m asking is I did an interview this week where we went back through history a little bit.
Shane Hanlon: Back in time. [music] Welcome to the American Geophysical Union’s podcast about the scientists and the methods behind the science. These are the stories you won’t read in a manuscript or hear in a lecture. I’m Shane Hanlon.
Nanci Bompey: And I’m Nanci Bompey.
Shane Hanlon: And this is Third Pod from the Sun. All right, Nanci. You’re wearing two hats today. What do you got for us?
Nanci Bompey: Today I am bringing you an interview I did with Stefan Talke. He’s a physical oceanographer and civil engineer at Portland State University, and I actually first met him a few years ago. I did a press release about a study that he published in one of our journals about changes in storm tides in New York City.
Shane Hanlon: Hmm.
Nanci Bompey: Yeah. That’s interesting, but really the cool thing was that him and his graduate student went back to find tide gauge data going all the way back to 1844.
Shane Hanlon: Oh, jeez.
Nanci Bompey: Yeah, and it was such an interesting story they went to the National Archives here and went through all this data, and it was-
Shane Hanlon: It’s not your normal, I guess, science expedition.
Nanci Bompey: Yeah.
Shane Hanlon: Going through the archives.
Nanci Bompey: Yeah, and I just thought it was so cool that we met up with Stefan again recently at our ocean sciences meeting in Portland to talk to him a little bit more about what he’s been doing since then, because they’ve been using this idea of going and using historical data for different places all over the country.
Shane Hanlon: Oh, wow.
Nanci Bompey: Yeah, super cool. Yeah, we talked about the whole process and some of the really interesting stories that they’ve uncovered in all this old data.
Stefan Talke: One of the things that scientists need are data, and one of the things that we can’t do is go back into the past and measure. One of the problems that we have is that we can’t go back and see what the climate was like in the 19th century, or that the ocean was like with any sort of accuracy.
So one of the things that I’ve been doing is looking into archives and finding old tide records, so old water-level records that were taken 100, 150, almost 200 years ago, and reconstructing, or digitizing rather, those records, and then looking at things like sea level and sea level rise, looking at historic storms, looking to see whether the tides themselves have changed over time.
Nanci Bompey: Let’s talk about that data that you find.
Stefan Talke: Right.
Nanci Bompey: Where do you get that data? Where do you find it? How do you get it?
Stefan Talke: You almost have to put on a historian’s cap in order to find it. You have to look into archives, so I started out going to NOAA and to the National Archives. More recently, we’ve looked at libraries or local archives, state archives, Army Corps archives, basically anywhere where old records are being stored. The most interesting place that we’ve found tide records were the libraries of MIT and the Harvard Business School library. That was based off of a tip that I had from a historian that perhaps the earliest scientific records are not stored in government archives but are stored in the private papers of engineers or scientists.
The way that measurements in the science in the US seems to have evolved is similar to how it did in England, where it was first it was hobbyists. They would go out and they’d make some measurements, and Thomas Jefferson is a famous example. Then, as the country started industrializing and building things, then the engineers came in, and that was this Loammi Baldwin in Boston. That was the 1820s, 1830s, 1840s era.
Then the government took over and sort of centralized it and professionalized it and made it more systematic. The real good tide measurements and systematic tide measurements start in about the 1850s in the US, and was led by a great-grandson of Benjamin Franklin, an interesting historic sidelight.
Shane Hanlon: I got to be honest, when I first heard tide gauges as a shorthand, when we were talking about this episode, I was a bit skeptical. I mean, tide gauges? But this is freaking fascinating.
Nanci Bompey: I know, I know. Who thought tide gauges could be so interesting. But it’s really interesting to hear about how these tide gauge readers actually did their work. Everything they had to contend with in this era is just crazy stuff.
Stefan Talke: There were these little cities … Not cities, towns. Maybe 1,000, 1,500 people at most in San Diego and Astoria. San Francisco was bigger. But they were basically these outposts of civilization. Before they were even a state here in Oregon and in Washington, there were tide measurements that were being made.
Some of the problems that they had to deal with are just totally different than … Some of the early hydrographic surveys in the 1850s up in Puget Sound, there’s notes that, “Well, we tried to survey here, but there were hostile Indians, and so we couldn’t.”
Shane Hanlon: This really puts being inconvenienced because of Metro into perspective, huh?
Nanci Bompey: I know, right?
Stefan Talke: The original measurements, so the really early measurements, they were all by hand, and then at some point in the 1850s, the Coast Survey introduced self-recording tide gauges or automatic gauges, and they basically worked on the principle that they would have a stilling well where there’s basically a float that goes up and down in a pipe kind of like a float in a toilet, and that would be connected to a chain, which would be connected to a pencil, and that pencil would move up and down on a piece of paper, which at the same time was being moved forward by a pulley mechanism that was being driven by a clock. So a mechanically driven system, but at the same time, when it worked well, you got a continuous measurement of the tide, minute by minute.
Those records were then reduced by either the observer or by what were called tidal computers in Washington, DC. Those were actual people that read that trace on the scroll and turned it into numbers. There was this organization, and in some ways it was really quite modern, because there was a central headquarters, which was in Washington, DC, but then they had tide observers all over the US and somehow they had to communicate with them, and the way they did it was through letters. There’s an astonishing amount of letters that went back and forth. So you end up diving into 19th-century correspondence and having to read the cursive and almost living their day-to-day existence, and then you find some treasures after looking through 200 of them.
Shane Hanlon: Wait. What does he mean by “treasures”? Is Nicolas Cage going to pop out at some point?
Nanci Bompey: Oh, yeah. Just wait.
Stefan Talke: One way I look at on the west coast there were three tide gauges, in San Diego, in San Francisco, and in Astoria, Oregon. The Astoria and the San Diego records, it’s kind of like a tale of two observers. The observer in Astoria had a lot of rectitude. He was always on time, he went out at 6 AM and at 6 PM every day and checked the gauge, and he did weather measurements three times a day, and if there was just the slightest problem he was on it and he apologized for the very slight mistakes that he made, and so you really get the feeling, “Okay, this guy, he was invested in it.”
The San Diego observer, on the other hand, there are times when it seems like the gauge is running really well, and then sometimes it just isn’t. He’d get letters, “Why aren’t you checking this twice a day?” They would just go on and on like that. Sometimes the whole Coast Survey even got embroiled in a controversy in which he … well he was in San Diego, but apparently he had a wife, or quote-unquote “wife,” in Washington, DC, who he had been giving money, and then he had stopped giving her money, and so everybody, there’s these letters going transcontinental asking him why is this happening, and he wrote back and said, “She is not my wife, and I was happy to support her, but then she was unfaithful.”
Yeah, and that was not the only time that he was embroiled in something. During the Civil War, he also … There was an anonymous letter that went to the Coast Survey and denounced him. I didn’t see the letter, but I saw the consequences of that letter, and so there was some back-and-forth, and you can imagine there’s this drama, but it’s probably being delayed by two or four weeks because it has to be sent by steamer across the country. In the end, he was denounced, and he said, “Well, even though I’m a Democrat and I don’t support this presidency, I am a patriot.” It ended by they made him sign a loyalty oath.
Nanci Bompey: Oh, wow.
Stefan Talke: I have that loyalty oath. Just to be fair, they also made the observer in Astoria sign the loyalty oath, although it was very clear that he was loyal. Yeah, so there’s these interesting intersections with real life that are happening. Sometimes it’s sad, like there was an observer in New York where he wrote a letter an apologized that he hadn’t been to the gauge for a few days because one of his kids had died.
During the Civil War, there were things that were happening too, like the same observer in New York couldn’t get out to Governors Island because there was a quarantine and the army was there and they were wondering, “What is this guy doing lurking around our docks?” That kind of thing. There are these sort of things that are happening, and make you realize, yes, this was a different time and place, but on the other hand, it’s also fairly modern in that you had … It’s like a corporation or a government agency, where you have these far-flung offices, and how do you make sure that they’re actually doing good work? They had these modern problems that they were …
These letters are sort of like the email of that age, and they’re trying to do good work, and so there was one observer at Pulpit Harbor in Maine, this little island that was really cold in the winters, and so there were some problems with the gauge at some point, and so they were mad at him for that. He wrote back and said, “You do me grave injustice to presume that I was not tending the gauge.” Then he explained that he had spent every single night sleeping in the tide house, or visiting it multiple times, keeping the fire going so that the gauge would not freeze up and seize. He had been doing that all the time.
Yeah, so you really get a sense for the people that were involved, and you get to know that, “Okay, maybe I shouldn’t trust this part of the Charleston record, for example, because the observer …” Well, I found some data, and written in the scrawl was, “I don’t know how much we should trust this data, because the observer seems to be addicted to sleep.” It continued and said, “The observer, or Mr. So-and-so, claims to be for the Blaine liquor law, but methinks that his red nose tells otherwise.”
Nanci Bompey: That’s great.
Stefan Talke: Right?
Nanci Bompey: Yeah.
Stefan Talke: These are the highlights that you could pick out, out of literally thousands, and in fact hundreds of thousands of documents. We’ve located and made pictures of, or downloaded, 300,000 documents so far, most of it just reams of paper, numbers, hour by hour.
Shane Hanlon: Methinks this is amazing.
Nanci Bompey: Yes, methinks so too.
Shane Hanlon: I could listen all day to the tide gauge observers’ version of The Young and the Restless, but getting back to the science, how do they get the data they actually need for the research?
Stefan Talke: They allow you to look at these records by hand, and so what I’ve done is I generally get a tripod and a camera and I set it up on the table, and I have an automatic clicker or automatic shutter release, and I just flip the page, take a picture, flip the page, take a picture. I do that as fast as possible, because there’s just limited time in an archive. We have to fly to Washington, DC, or somewhere else, and there’s only eight hours in the workday, so I don’t even really look or try to analyze the records while I’m doing it. It’s more like get in and get out.
So in some ways it has some analogies with field work that I’ve done in the past, where you go out on a boat and you have an instrument, and you throw it overboard and you try to get as many profiles as possible. Then, once you go back, then you try to load up the data or make it useful for science. It’s basically the same process. We go in, we get the data, we then take it home. We’ve had an army of students, literally many, many, many different students, including high school students in the summer, have contributed to entering these data into Excel sheets.
Shane Hanlon: I’m having flashbacks … I’m having a lot of flashbacks … To undergrad this time.
Nanci Bompey: Maybe you’re in the ’70s.
Shane Hanlon: I wasn’t alive in the ’70s. But flashbacks to when I was part of my own army of undergraduates. But I want to know, once they get the data, what are they doing with it? What are they actually finding out?
Nanci Bompey: This is where it gets really cool. They actually can tell how much sea levels are changing and tides are changing in specific areas, like Boston Harbor.
Stefan Talke: So the USS Constitution is moored in the dry dock that was built in the 1820s. In order to figure out how high to build it so that it wouldn’t flood, and how deep to build it, they made tide measurements, and so their reference to that dry dock. So we know that the dry dock was built 15 feet above a datum that’s now known as the Boston Base, and it was propagated forward in time, and so we can therefore connect using a combination of this historical sleuthing, and looking at the papers, the original letters and papers of these engineers and scientists, we can figure out datum or surfaces or benchmarks that still exist today and through that we’re able to get a really long record of sea level.
Not surprisingly, it shows that indeed there is sea level rise, and in Boston it’s about a foot. But what matters is that it’s a verification of the record in New York, which was previously the longest record that we have. We’re also able to look at where they differ in the small details and try to understand why. Hopefully what that does is it gives us a better long-term view of what sea level rise has been, and also what are some of the local factors that are important, such as the vertical land motion and things like that. Because in the end, it’s the individual communities that are going to be feeling the effects of the climate change, and therefore we want the more records you have, the better.
One of the things that, for example, if you’ve gone to a harbor recently, you would see that … Or to a river, the ships are huge now. In order to allow these big ships to go into our harbors, the harbors themselves have been deepened, sometimes by a factor of two or three or even four. We’ve really changed the geometry of our coastal systems, and these tide records allow us to sometimes show that there’s been a huge change as a result, and how the water flows into and out of these harbors and therefore in things like the tides.
It used to be a storm surge would come to the coast and then damp out, totally decay. The energy would be lost in the wetlands or in the shallow waters. But if you make something deep there’s nothing to impede it, and in effect we’ve invited the sea in in some cases, and so we have some … We’ve been able to use the historic measurements and some modeling to show that in the Cape Fear Estuary in Wilmington, North Carolina, that you have seen probably a large increase in the worst-case scenario for storm surge.
My motivation is not just to be into these old records with fun. That’s really fun, right? To dive into this other time where there were more gentlemanly scientists and it was just different. But at the same time, we live today and we have these issues that are coming down the pike in the next 20, 30, 40 years, and to the extent that these trends … To the extent that the past is preview, or can help us understand trends and why they are happening and help us better predict what things will look like. That’s what motivates me.
Shane Hanlon: I say, madame, you did me a grave injustice today by not inviting me to lunch with you and your esteemed colleagues.
Nanci Bompey: Methinks you are mistaken, sir. You were invited. We did extend an invitation to you. Actually, I think you extended the invitation to yourself.
Shane Hanlon: Oh, I totally invited myself. No. All right, folks. That’s all from Third Pod from the Sun. Thanks, Nanci, for bringing us the story and for Stefan for sharing his work with us.
Nanci Bompey: This podcast is also produced with help from Josh Speiser, Olivia Ambrogio, Caitlyn Camacho, and Lauren Lipuma. And thanks to Kayla Surrey for producing this episode.
Shane Hanlon: The AGU would love to hear your thoughts, so please rate and review this podcast. We really appreciate it. It really helps people find out what we’re doing and who we are, and you can find new episodes on your favorite podcasting app or at ThirdPodFromTheSun.com.
Nanci Bompey: And that’s a wrap.
Shane Hanlon: All right, that’s all. Thanks, folks, and we’ll see you next time.